Why ROAS Is Lying to You
Marketers worship ROAS. But what if I told you it’s a flawed metric.

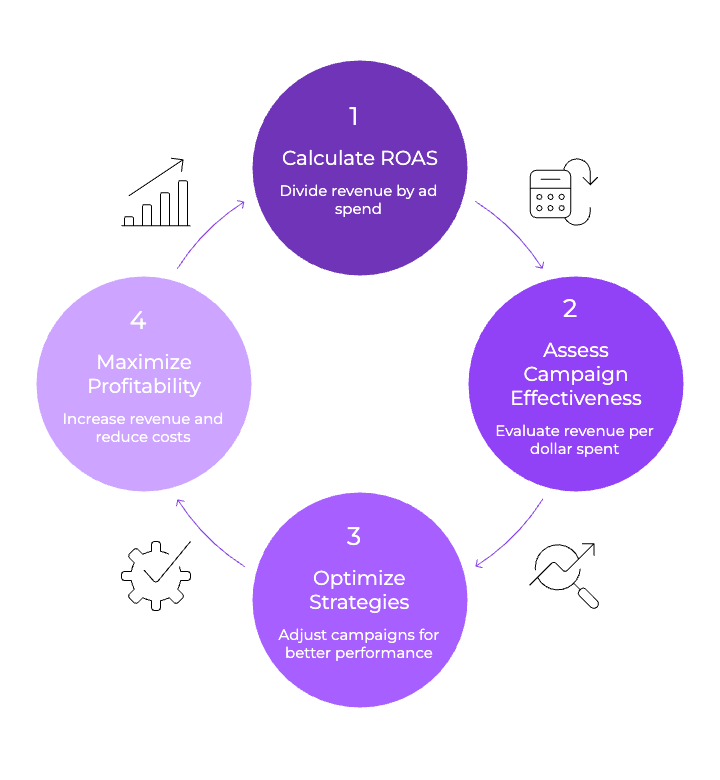
Sure, the formula seems straightforward:
But this surface simplicity masks its vulnerability. In today’s ecosystem of iOS limitations, cookie deprecation, and multi-device journeys, the “revenue” in that equation often isn’t real. And when the revenue’s wrong, your entire strategy is built on sand.
The Illusion of Positive ROAS
Let’s simulate what many marketers think is happening:
Ad Spend: $10,000
Attributed Revenue (via Meta): $35,000
ROAS: 3.5 ✅
Sounds amazing, right?
But now factor in what you didn’t see:
- 27% of orders already came from returning users (excluded from paid attribution)
- 19% were double-attributed across Meta and Google
- 11% came in via email but touched ads 3 days earlier (not captured in last-click models)
Recalculated Actual Revenue (Post De-duplication & Cross-Channel Sync):
Real Ad-Driven Revenue: $21,300
Actual ROAS: 2.13 ❌
That’s a 39.1% inflation.
And it’s not a hypothetical. In a 2024 Nielsen ROI meta-study, 64% of ecommerce brands overstated ROAS by 20–50% due to flawed attribution models and platform biases.
The Real Cost of “Fake ROAS”
Let’s say you scale based on that misleading 3.5 ROAS:
| Spend Level | Estimated Revenue (Meta ROAS) | Actual Revenue (Corrected) | Real ROAS | Hidden Loss |
|---|---|---|---|---|
| $10K | $35,000 | $21,300 | 2.13 | zero |
| $50K | $175,000 | $106,500 | 2.13 | -$68,500 |
| $100K | $350,000 | $213,000 | 2.13 | -$137,000 |
Scaling aggressively on inflated ROAS isn’t just risky. It’s financially catastrophic.
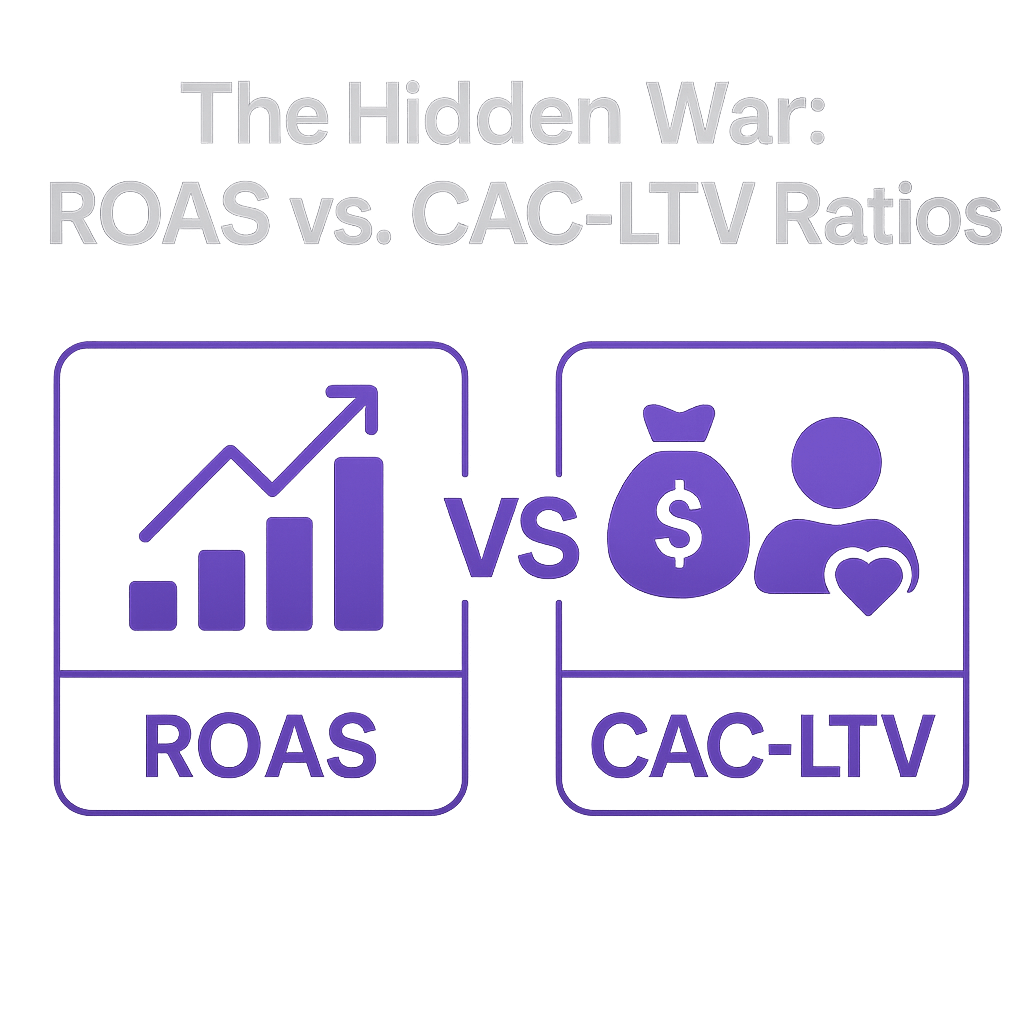
The Hidden War: ROAS vs. CAC-LTV Ratios

ROAS treats every dollar as equal, but growth marketers know that Customer Acquisition Cost (CAC) and Lifetime Value (LTV) define real profitability.
Take this scenario:
- Product A ROAS = 1.8, but LTV = $650, CAC = $210 → Profitable
- Product B ROAS = 3.0, but LTV = $180, CAC = $60 → Less profitable
ROAS tells you to kill Product A. Your finance team begs you not to.
Trackity solves this by:
- Blending ROAS with session-based LTV prediction models
- Auto-segmenting first-time vs. returning users
- Visualizing ROAS vs. CAC-to-LTV ratios, not just spend-to-revenue
What’s Actually Warping Your ROAS?
Here are the hidden mechanics few platforms tell you about:
| Distortion Source | Impact on ROAS | How Trackity Neutralizes It |
|---|---|---|
| Meta Double Attribution | +15–25% | Server-postback deduplication |
| Delayed TikTok API Sync | -10–12% | Real-time streaming + Kafka |
| Blocked Pixel (iOS/AdBlock) | -20–35% | Dual-layer tracking (JS + server) |
| Email/Influencer Overlap | ±18% | UTM + zero-party matching |
| Affiliate Misattribution | +5–10% | Source-weighted attribution logic |
Without filtering out these attribution ghosts, you’re chasing shadows.
Trackity: How It Actually Calculates “Real ROAS”
Trackity doesn’t just “track better.” It reconstructs attribution with forensic precision:
🧠 Attribution Weighting Engine
Uses Markov Chain models to assign probabilistic credit across touchpoints. For example:
- Email opened = 0.1 influence weight
- Meta view + click = 0.4
- Google search post-ad = 0.3
- Final session (direct) = 0.2
Final revenue credit is proportionally split
🔍 Advanced Cross-Device Stitching
Leverages fingerprinting + session correlation to combine:
- Device IDs
- GCLID + FBCLID
- IP clusters
- Login & UTM data
Result: up to 92% match rate across devices.
📈 Server-Verified Revenue
Order-level matching via:
- Shopify webhooks
- WooCommerce REST API
- Google Ads Click ID correlation (GCLID, WBRAID)
Combined, these result in 99.3% attribution accuracy, versus the 64–78% most merchants operate with.
From “Good Enough” to Growth Engine
Here’s what ROAS looks like through Trackity’s real-time lens:
| Channel | ROAS (Meta Reported) | ROAS (Trackity Verified) | First-Time Customer % | 30-Day LTV |
|---|---|---|---|---|
| Meta Ads | 3.2 | 2.1 | 68% | $380 |
| Google Ads | 2.7 | 2.5 | 42% | $270 |
| zero | 5.9 | 22% | $510 | |
| TikTok Ads | 2.9 | 2.0 | 79% | $210 |
Now you’re not just seeing your ROAS. You’re understanding it.
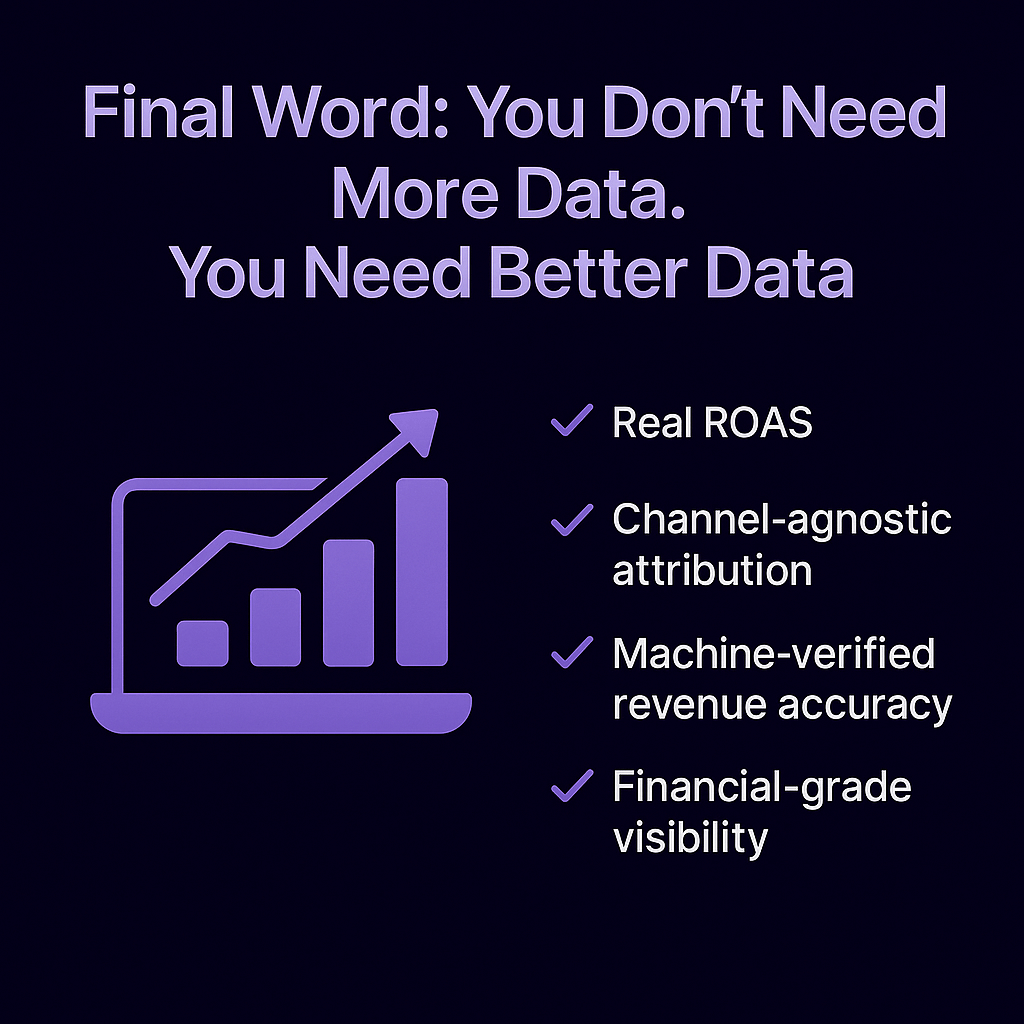
Final Word: You Don’t Need More Data. You Need Better Data.

Trackity isn’t just a tracking tool. It’s a decision-making engine, built for marketers who want more than pretty dashboards, they want profitable scale.
✅ Real ROAS
✅ Channel-agnostic attribution
✅ Machine-verified revenue accuracy
✅ Financial-grade visibility
→ Start your free 30-day test. No credit card. Full access.
Uncover the truth behind your ROAS, because strategy starts with seeing clearly.

