ROI Is Misleading You: Unless You’re Calculating It Like This
In ecommerce, everyone throws around ROI like it’s gospel.
But here’s the truth: most ROI models are built on faulty math, incomplete data, and outdated assumptions. That’s not hyperbole, it’s a harsh reality confirmed by a 2024 Bain & Company study, which found that 82% of DTC brands measure ROI without factoring in full operational costs or cash cycle timing.
Let’s fix that!
The Basic Formula? It’s Just the Tip of the Iceberg
Most marketers still cling to this:
ROI = (Revenue – Cost) / Cost
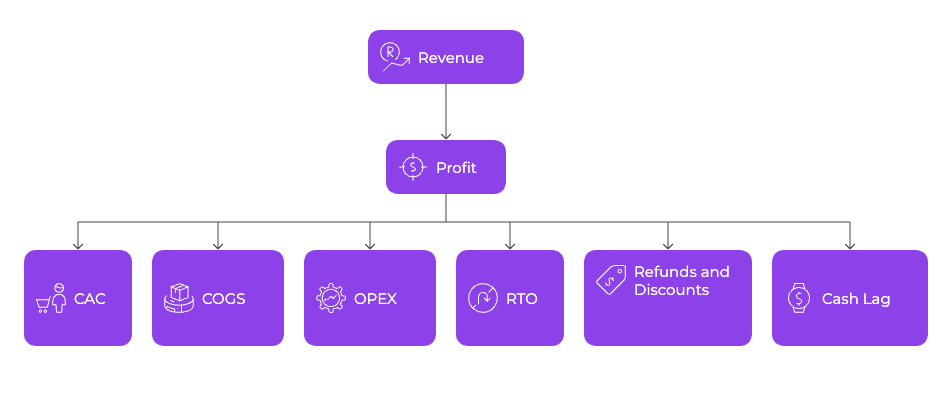
But revenue ≠ profit. And “cost” isn’t just ad spend. It’s an iceberg of hidden variables:

- CAC (Customer Acquisition Cost)
- COGS (Cost of Goods Sold)
- OPEX (Operational Expenses: fulfillment, payment processors, support)
- RTO (Return-to-Origin Rate)
- Refunds and discounts
- Cash lag (time to recover spend)
To get a real, scalable ROI model, you need to dig deeper.
Let’s Break It Down: A Full-Funnel ROI Calculation
Here’s a more advanced formula for per-campaign ROI:
ROI = (LTV × Gross Margin – CAC – Ops Cost per Order – Refund Loss – Retention Cost) / CAC
Let’s apply this to a real-world example.
Brand X runs a Meta campaign for a DTC skincare product.
- CAC: $72
- Avg. Order Value (AOV): $68
- COGS per unit: $21
- Gross Margin: 69.1%
- LTV (6-month projected): $185
- Refund Rate: 9%
- Refund Cost per order: $14
- Fulfillment + Support + Payment Fee per order: $6.80
- Retention cost (email, loyalty, etc.): $9.25
Real ROI =
→ (185 × 0.691 – 72 – 6.80 – (0.09 × 14) – 9.25) / 72
→ (127.835 – 72 – 6.80 – 1.26 – 9.25) / 72
→ 38.525 / 72 = 53.5%
🧨 Most marketers would estimate this ROI at 157%. It’s actually 53.5%.
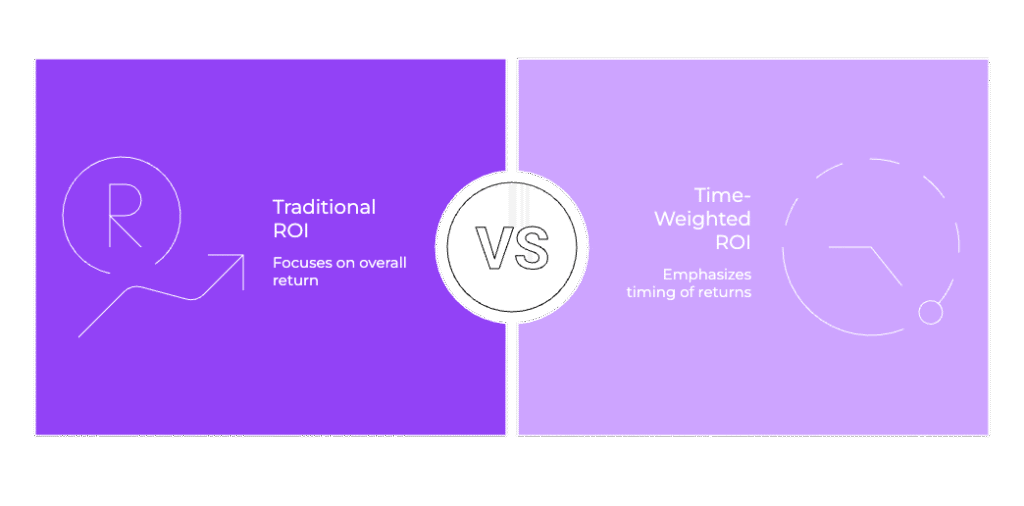
The Invisible Killer: Payback Period (Time-Weighted ROI)

Even if your ROI looks good on paper, you’re still at risk, because timing matters.
Here’s how delayed LTV realization can destroy cash flow:
Payback Period = Time to Recoup CAC
Assume a 3-month LTV of $185 and CAC of $72:
| Month | Cumulative Revenue | Profit Realized | Cumulative ROI |
|---|---|---|---|
| 0 | $68 | $68 – $72 = –$4 | –5.6% |
| 1 | +$42 | $42 | 38.3% |
| 3 | +$75 | $117 total | 62.5% |
Now factor in your cash cycle: if your vendors bill monthly but revenue trickles in quarterly, you’re scaling losses until you run dry.
📉 Positive ROI after 3 months ≠ positive cash flow today.
Research You Probably Didn’t Know (Yet)
Here are a few rarely cited insights that dramatically impact ROI performance:
1. TikTok Has the Highest CAC-LTV Gap
(Source: Klaviyo + Triple Whale joint 2024 study)
- CAC is 18–24% higher than Meta
- LTV is ~38% lower
- TikTok ROI tends to inflate early, drop sharply post-trial window
2. Post-Purchase Upsells Increase ROI by 27–40%
(Source: ReConvert 2023 benchmark)
- Average upsell revenue: +$7.90/order
- Cost to implement: negligible (zero CAC)
3. Blended CAC (including retention/loyalty spend) drops ROI by 14–19% on average
(Source: eCommerceFuel survey)
- Email, SMS, and loyalty bonuses often get left out of CAC
- Including them gives a truer ROI model, and often reveals inefficiencies
4. Bundling increases ROI faster than A/B testing creatives
(Source: CXL Institute 2023 case study)
- Bundles increased AOV by 22%
- A/B testing creatives led to 8% lift in conversion, not revenue
How Trackity Brings All of This Together
Trackity isn’t just an attribution tool. It’s a profit intelligence system.
💰 Revenue-Based ROI, Not Click-Based
Trackity cross-references actual order data, COGS, and refunds with ad spend to calculate true net ROI in real-time.
📊 Custom ROI Dashboards
Segment ROI by:
- Product category
- Traffic source
- First vs. returning customers
- Campaign objective (conversion, lead gen, etc.)
📉 ROI Decay Charts
Track how ROI changes over time, not just cumulatively, but by payback period and customer aging.
📈 UTM-Level ROI Blending
See the ROI from:
- A TikTok ad → Click → Influencer code → Email
- All tracked, time-weighted, and revenue-matched
🧮 Financial ROI Score™
A proprietary Trackity metric that weighs:
- ROI%
- CAC velocity
- Payback time
- Retention leverage
To deliver one predictive health score for each channel or campaign
Final Word: ROI Isn’t a Math Problem. It’s a Cash Strategy.

You’re not just trying to spend less and make more.
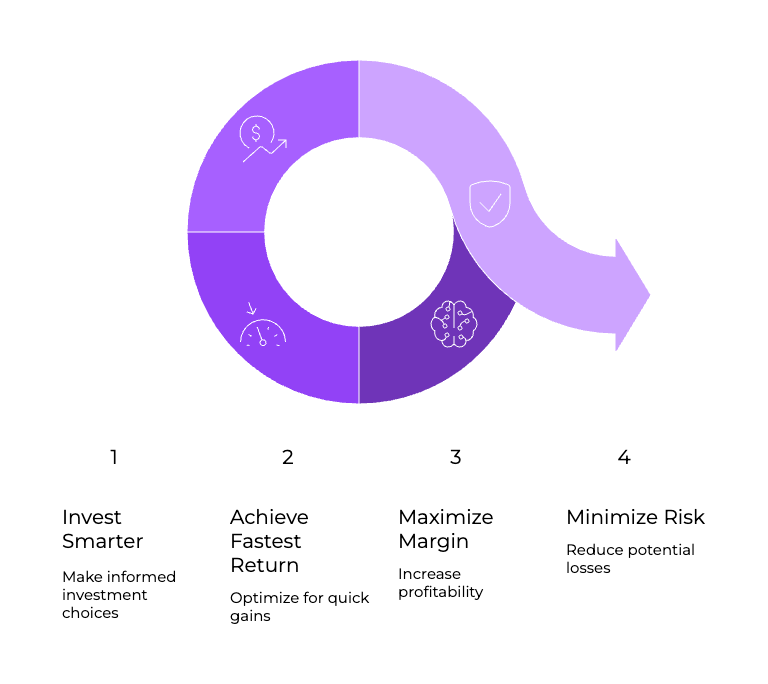
You’re trying to invest smarter with the fastest return, the most margin, and the least risk.
📉 Inflated ROI kills businesses slowly.
📈 Verified, real-time ROI grows them predictably.
Trackity makes ROI transparent, so you can make scaling a science.

